![Klir_Logo_Colour-B.png]](https://knowledgehub.klir.com/hs-fs/hubfs/Klir_Logo_Colour-B.png?width=181&height=90&name=Klir_Logo_Colour-B.png)
This one's for admins setting up bench sheets in Form Builder, whether you're starting fresh or tweaking an existing form. Here's how to find your forms, start a new one, set up your groups, and get it ready to print or scan.
Finding Your Way Around Form Builder
From the sidebar, select Data Collection > Form Builder. You'll land on a list of every form you've created, with columns for form name, status (complete or incomplete), facility, collection frequency, bench sheet type, and date created.
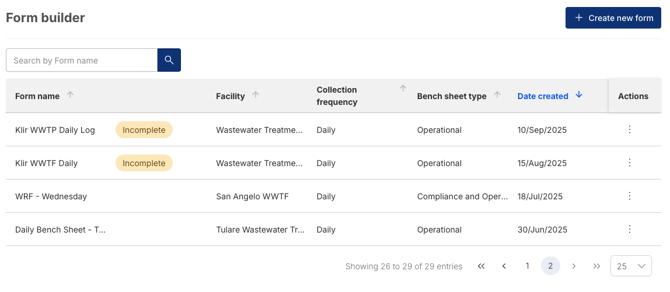
From the action menu on any form, you can:
• Manually enter data, for teams not using the Smart Capture app to capture readings.
• Copy the form to make a revision or to use it as a starting point for a similar form.
• Edit the form, available only while it's still incomplete.
• Export to PDF, available once the form is complete and submitted.
• Delete the form, available only for incomplete forms. Completed forms can't be deleted.
Starting a New Form
Click Create New Form in the top right corner, then fill in:
• Form Name
• Collection Frequency: Daily, Weekly, or Monthly. This determines how you'll configure groups in the next step.
• Bench Sheet Type: Operational, Compliance, a mix of both, or Other.
• Limit Set (optional): link one to automatically evaluate incoming data against your stored thresholds.
• Facility: so the data routes and displays correctly on your results page.
• Tags (optional): for organizing this sheet's results.
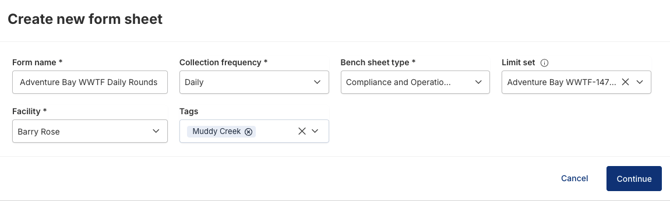
Note: Once you select a collection frequency and click Continue, it's locked in for that form. If you need a different frequency later, you'll need to start a new form.
Click Continue to move into group configuration.
Configuring Groups
Every form is built from one or more groups, and every group needs a name. What you configure inside a group depends on the collection frequency you chose.
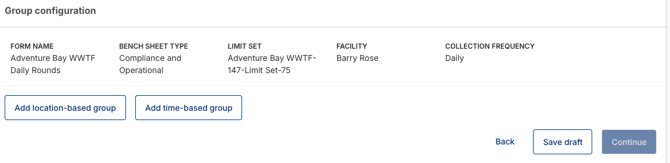
Daily Sheets: Location-Based & Time-Based Groups
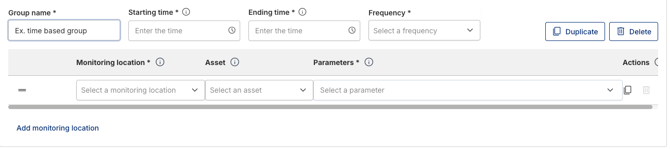
• Location-based group: name the group, then select a monitoring location, any applicable assets, and the parameters or operational fields being logged there.
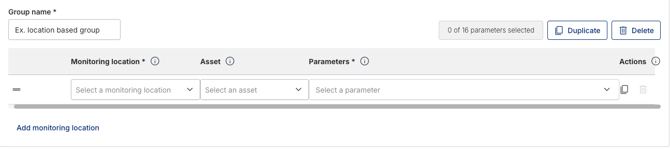
• Time-based group: name the group, then set a starting time, an ending time, and a sampling frequency within that single day, along with a monitoring location, an asset (if applicable), and parameters. Parameter selection is multi-select.
Weekly Sheets
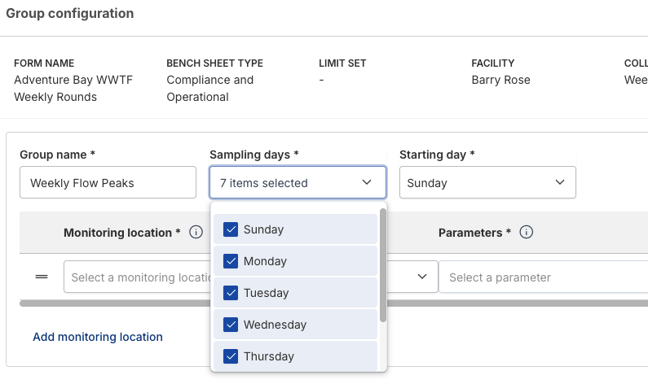
Time-based groups aren't available on weekly sheets. Instead, for each group you'll provide a group name, select the sampling days (multi-select, for example Monday through Friday), and set the starting date of that week, along with the same monitoring location, asset, and parameter fields used on daily sheets.
Monthly Sheets
You'll first set the number of days in the collection period, anywhere from 28 to 31, then provide a group name, monitoring location, asset, and parameters, following the same pattern as daily and weekly sheets.

Working With Group Rows
Each row in a group has a duplicate and a delete button to its right.
• Duplicate a row when you have a list of similar parameters or locations. Adjust the monitoring location and parameters on the copy instead of building each row from scratch.

• Click Add Monitoring Location to start a fresh row instead.
• You can duplicate or delete an entire group, and add as many location-based or time-based groups as your sheet needs.
Note: You can reorder the line items within a group by holding the two-line icon on the left side of a row and dragging it to a new position. Groups themselves can't currently be reordered.
A Few Built-In Checks
Before you can move forward, Klir double-checks a few things for you:
• Each group's parameter table fits on a single portrait page, with a maximum of 16 columns and 35 rows per group.

• No parameters are duplicated within a group.
• All required fields are complete, including group names.
Previewing, Finalizing & Printing
Once your groups are configured, save the form as a draft to finish later, or click Continue to preview it.
• The preview shows a visual grid: locations appear as rows, and parameters or time slots appear as columns. Unconfigured cells display an “X.”
• A unique QR code is generated in the page footer, so the printed form can be scanned with the Smart Capture app.
• You can reorder table blocks in the preview if needed. Just drag and drop the specific table or column to their desired spot.
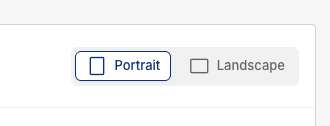
• In the top right corner of the preview, choose Portrait or Landscape orientation for the printout. *this is not editable once the form is submitted.
When you're ready, click Submit. This locks the form's structure, locations, parameters, and layout can no longer be changed, and makes the form available to export as a PDF and print for use at your plant, alongside Smart Capture or manual data entry.